

Before you start
- You need an owner or admin account.
- Choose the creators and the period first. The records follow the report as it is on your screen.
Two ways to get the records
On the Dashboard, the Earnings bars and the Today chart open the same records windows.
Open the records behind a figure
1
Open the report
In OnlyX, click Analytics. Then click the report you want.
2
Click the figure
Click a bar in a chart. You can also click a See fans, See sends, See messages, See replies or See comparison link.A window opens and says “Loading details…” while it reads every record.
3
Check the records
Read the number of records at the top, for example “125 records”, and the summary under it, if there is one.The records come from the same calculation as the figure you clicked, so they add up to it.
4
Find the rows you need
Type in the Search box to show only the rows that contain your text. Click a column heading to sort by it.
5
Show more columns
Click the columns button, which shows Choose columns when you point at it. Tick the columns you want to see.
6
Export the records
Click Export all records.Your browser downloads a CSV file with every record in the window.
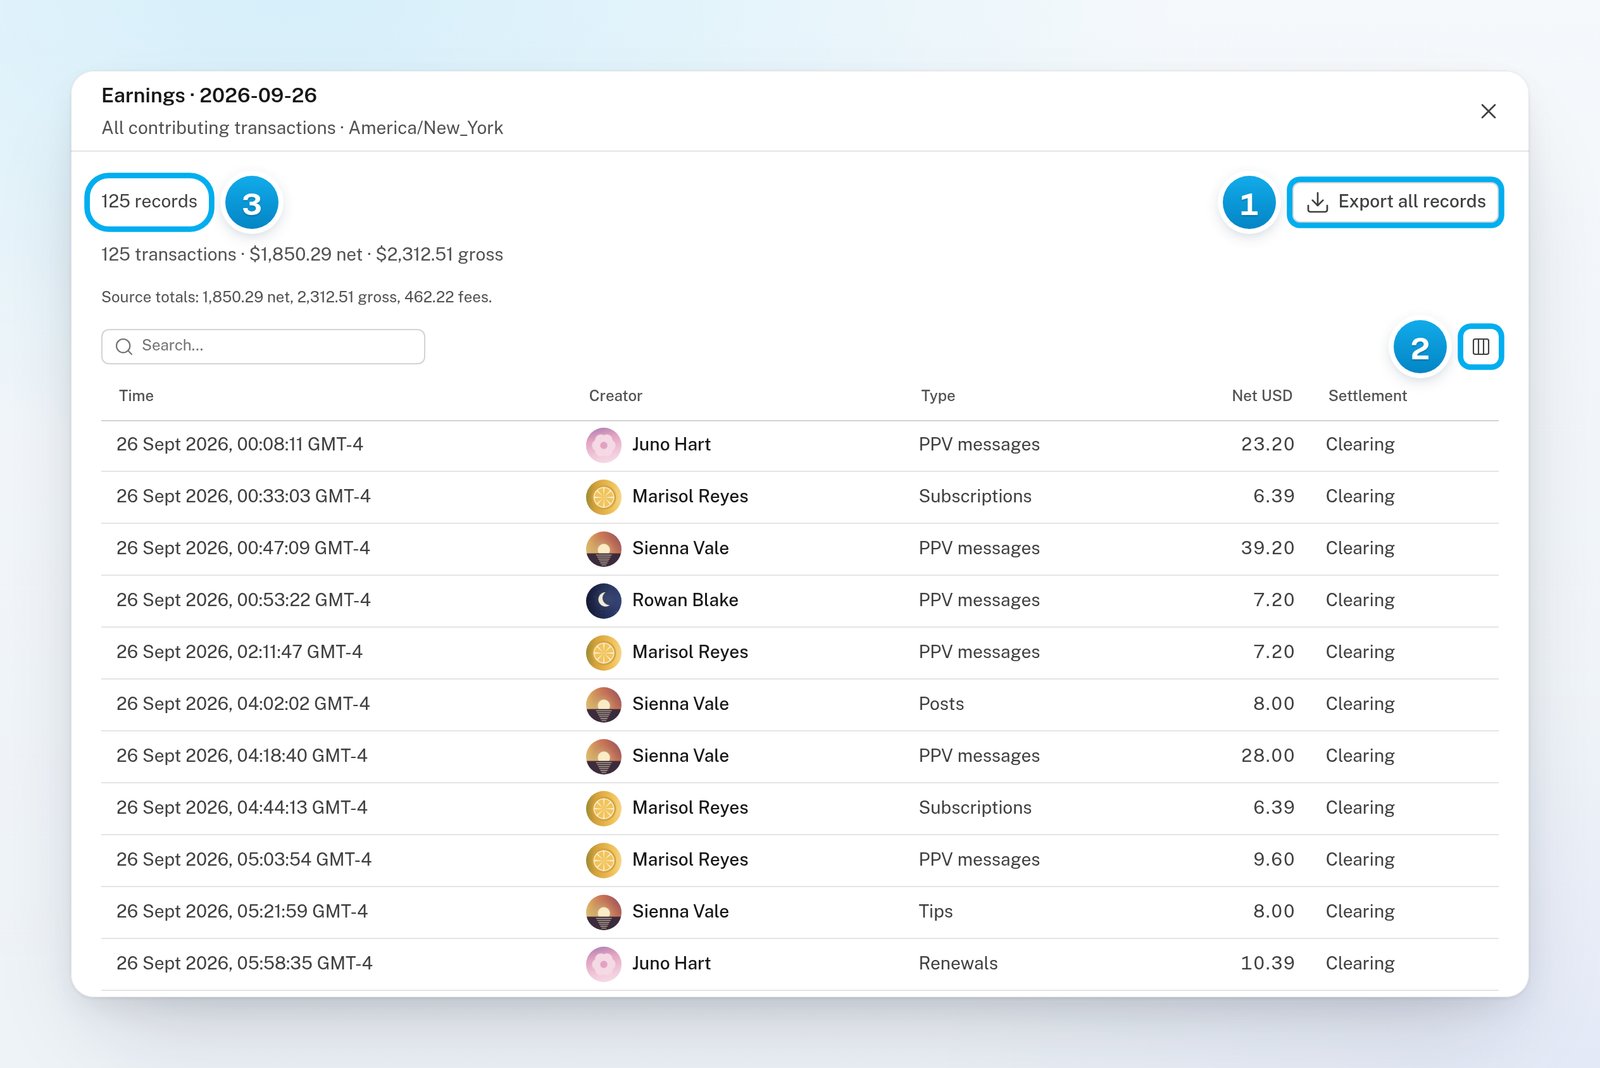
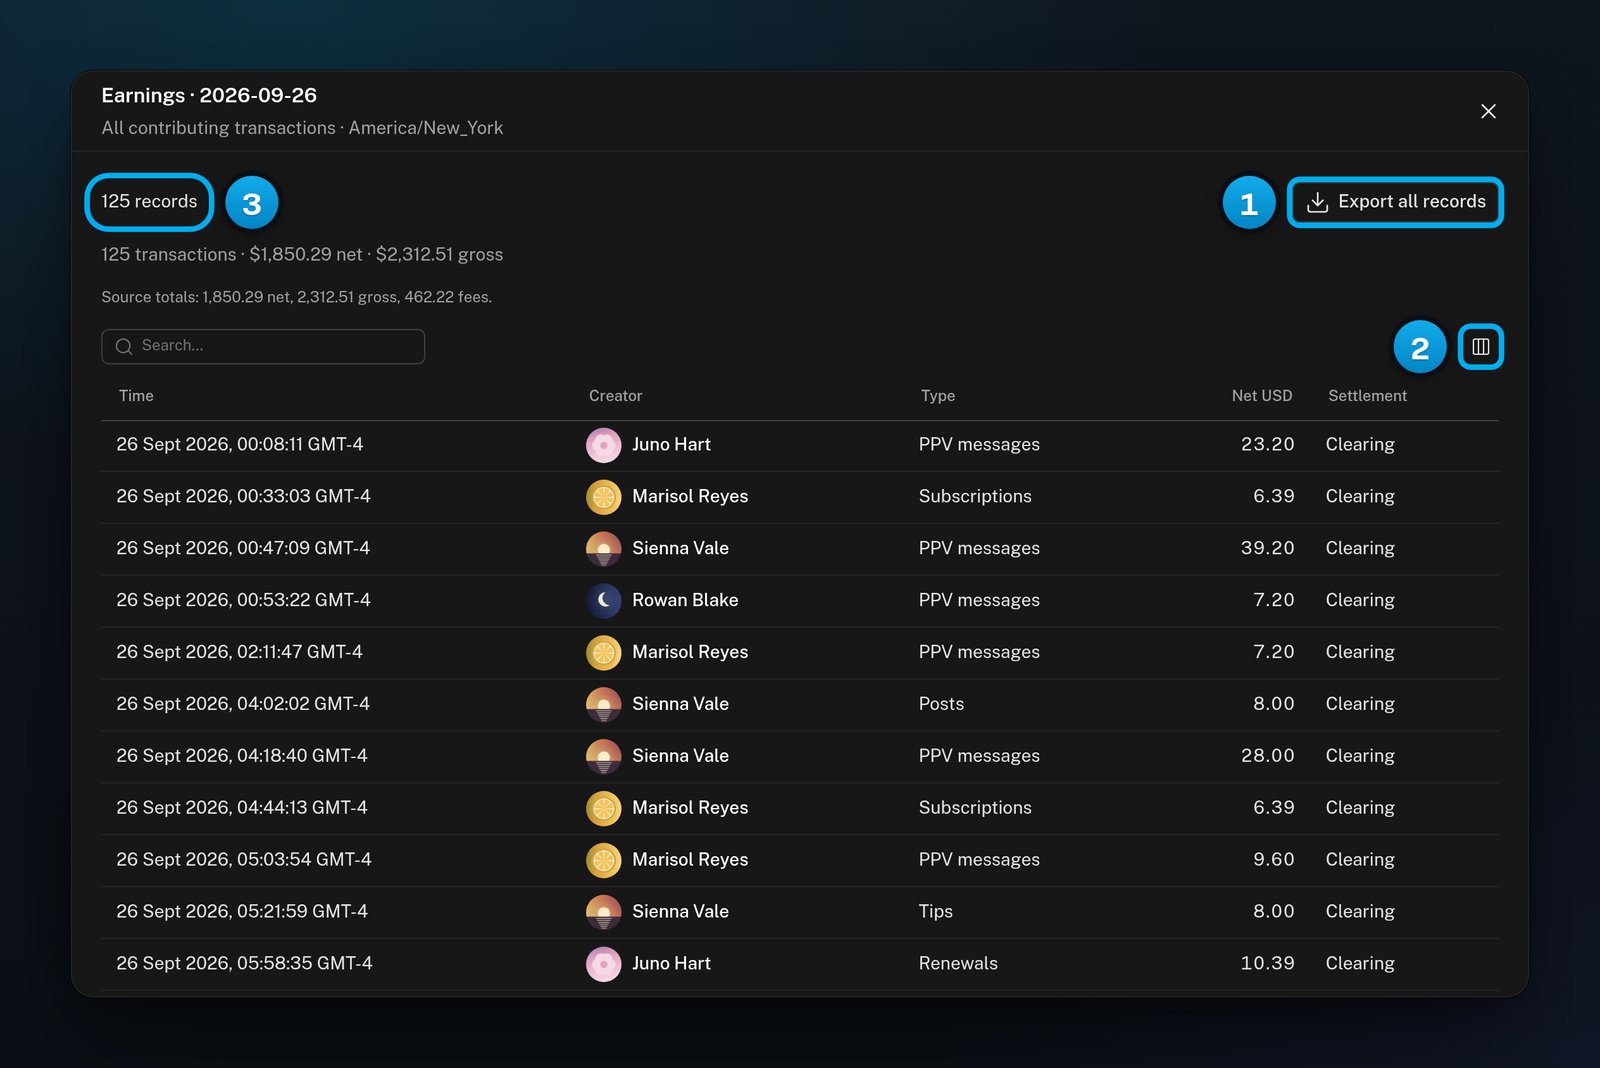
1 Download every record · 2 Show hidden columns · 3 How many records are behind the bar
The earnings records
When you click a bar of an earnings chart, the window’s title is “Earnings” and the day, for example “Earnings · 2026-09-26”. A week bar on the Dashboard shows both days, for example “Earnings · 2026-09-20 to 2026-09-26”. The line under the title names the reporting timezone. The summary gives the number of sales and their net and gross totals, for example “125 transactions · 2,312.51 gross”. A second line gives the exact totals with fees.
These columns are hidden until you tick them in Choose columns: Gross USD, Fee USD, Platform fan ID, Platform transaction ID, Source row ID and Creator ID.
“Settled” means that OnlyFans reports the sale as done. It does not prove that the money reached a bank account.
Check a sale against OnlyFans
To match a sale with the creator’s OnlyFans statement, tick Gross USD, Fee USD and Platform transaction ID. The transaction ID is the one OnlyFans uses. The CSV file has these columns already.Export a report table
1
Go to the table
In the report, scroll to the By creator table.
2
Optional: Sort and choose columns
Click a column heading to sort. Click the columns button (Choose columns) to show more columns on screen.
3
Download the table
Click Export.Your browser downloads the table as a CSV file.
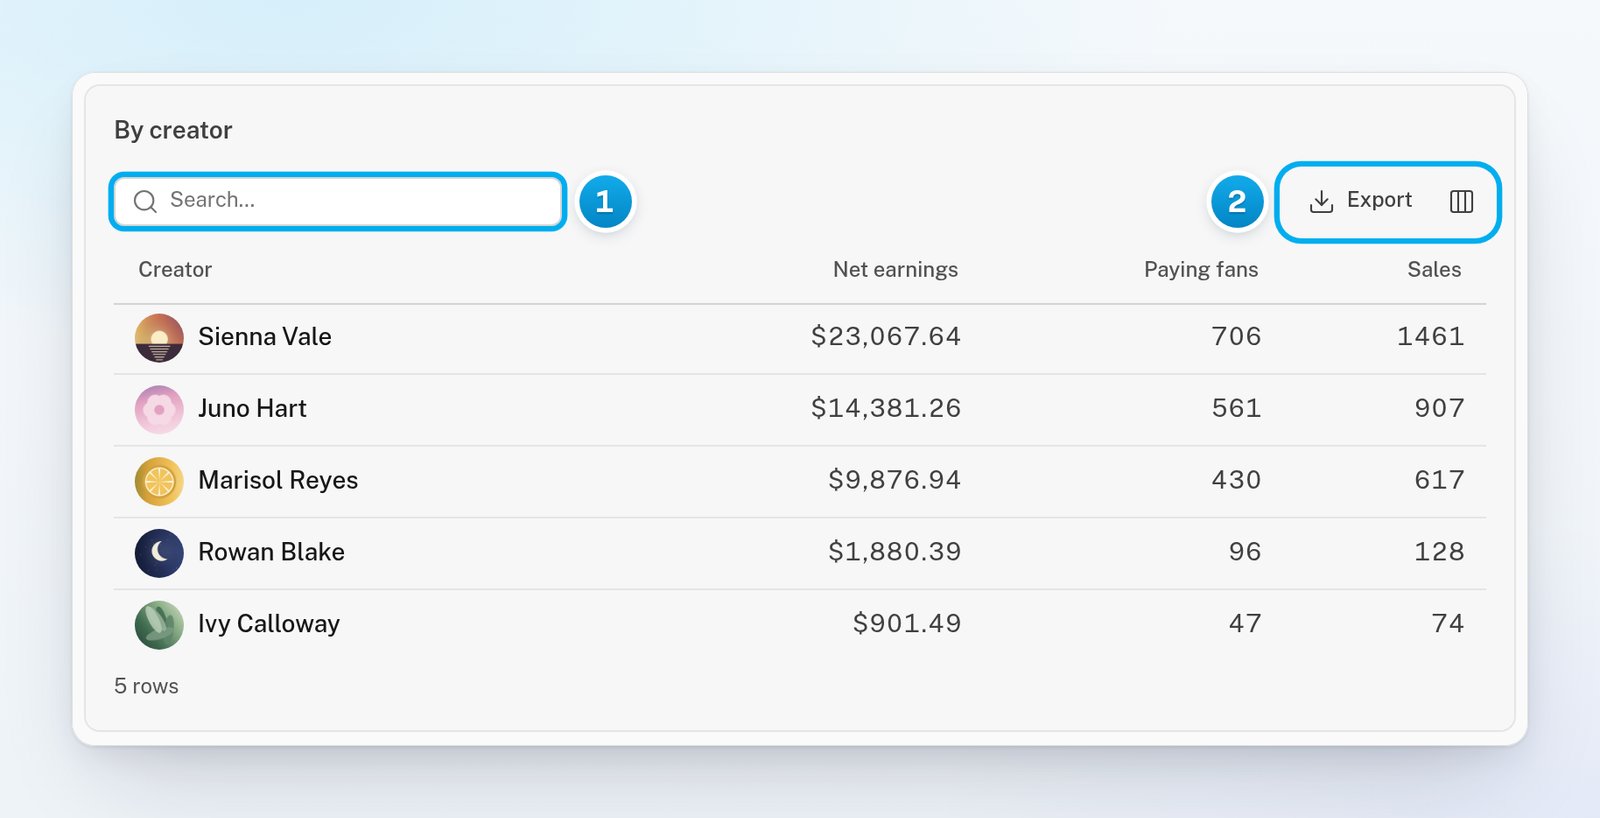
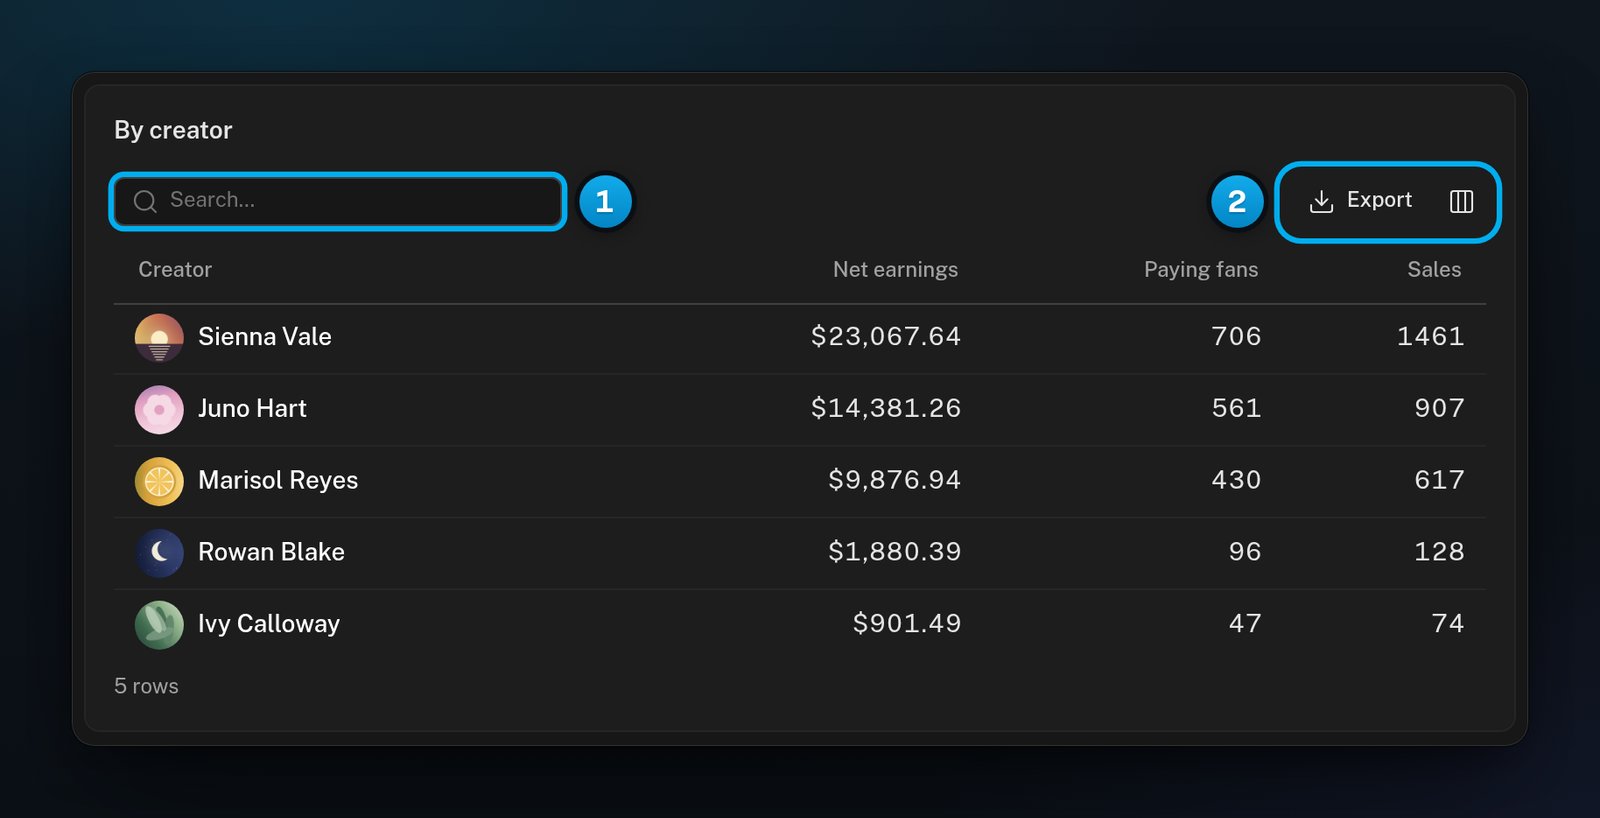
1 Find a row · 2 Export the whole table, or choose its columns
What is in the CSV file
An export always holds everything:- every row, even the ones your search hides;
- every column, even the ones you did not tick.
- The first columns describe the report and repeat on every row, such as
reportTimezone,reportStart,reportEnd,reportAsOfandsourceFingerprint. A records window adds a few more, such as the day you clicked. - Amounts are plain numbers with their full precision, for example 7.992. OnlyFans’ own records keep fractions of a cent, and the charts round them.
- Times are in UTC. For example, the earnings Time column is exported as “Transaction time UTC”.
- Text that starts with =, +, - or @ gets an apostrophe in front. A spreadsheet then does not run it as a formula.
If something goes wrong
The window says "No row-by-row breakdown for this report"
The window says "No row-by-row breakdown for this report"
The chart you clicked, or the whole report, covers more than 50,000 records, which is too many to list. Select fewer creators. On a report with a period, you can also pick a shorter one. Then open the chart again.
The window says "The report source changed. Refresh the report."
The window says "The report source changed. Refresh the report."
The report was calculated again while the window was loading, so its records changed. Click Refresh report, then click the figure again.
Export all records is grey
Export all records is grey
The window is still preparing the file. Wait a moment: the button turns on when the file is ready.
The CSV file has more rows or columns than the screen
The CSV file has more rows or columns than the screen
That is expected. An export has every row and every column. It includes rows your search hides, and columns you did not tick.
The amounts in the CSV file have more decimals than the screen
The amounts in the CSV file have more decimals than the screen
OnlyFans’ records keep fractions of a cent, and the file keeps them too. The charts, tiles and tables round them to the cent.